Median vs P90 Reply Time: Why Your Average Hides Slow Replies
Your average reply time can look fine while three buyers waited two hours. How median, p90 and the unanswered count work, with a 20-message example.
In this article
Median reply time tells you how long a typical customer waited. P90 response time (the 90th percentile) tells you the wait that 90% of customers beat, so it exposes the slowest 10%. An average can be dragged around by a few very long waits and often describes nobody. For a small shop, watch the median for the everyday experience, the p90 for the customers you're quietly losing, and the count of unanswered conversations above both.
Key takeaways
- Median = the middle wait. P90 = 90% of customers waited this long or less. Average = total wait divided by conversations.
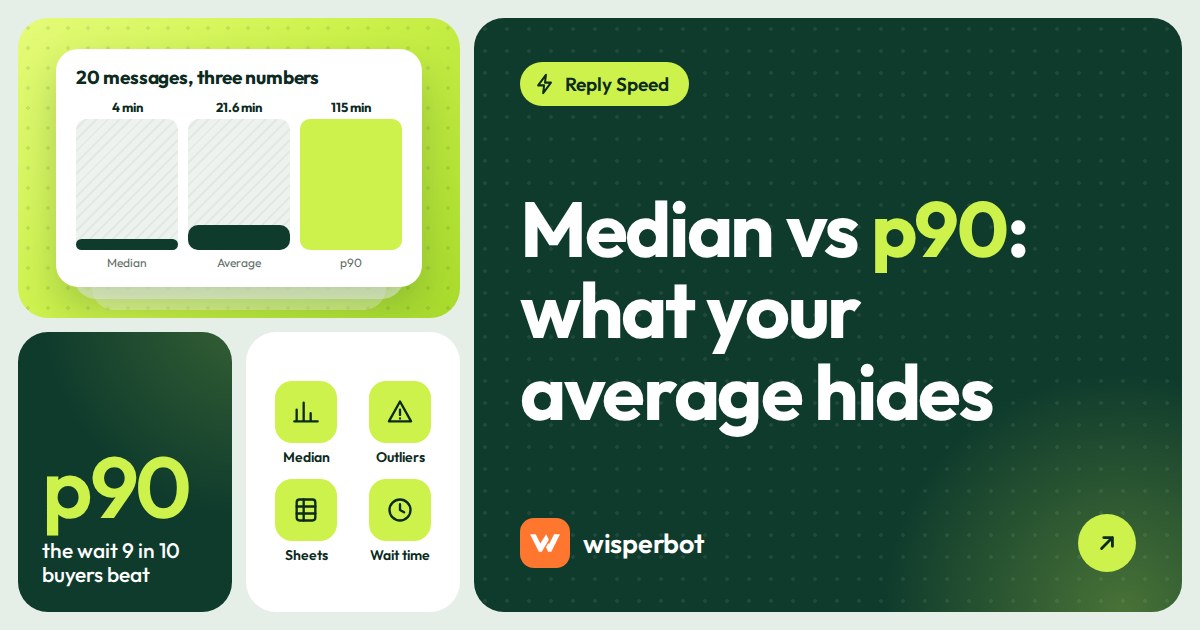
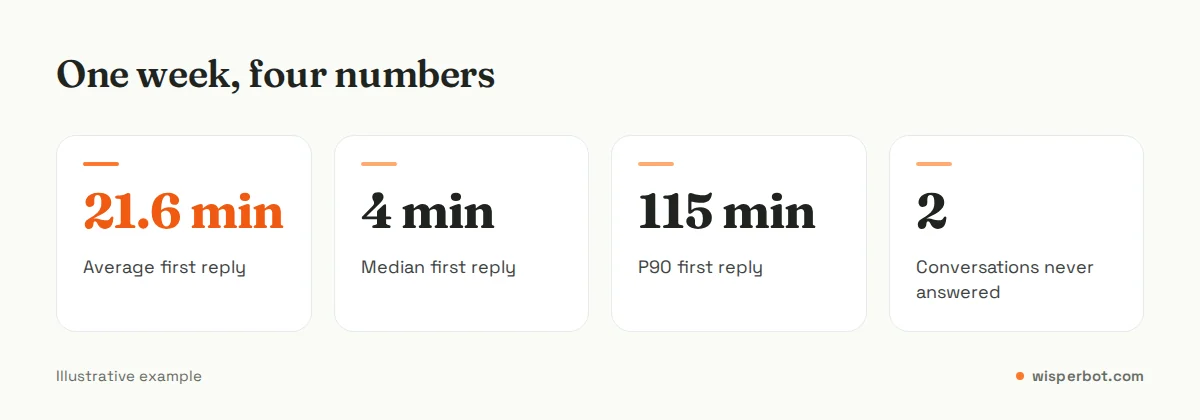
- In our 20-message example the average is 21.6 minutes, the median is 4 minutes and the p90 is about 115 minutes. Three buyers waited around two hours.
- In Google Sheets,
=MEDIAN(range)and=PERCENTILE(range, 0.9)give you both in a minute. - Unanswered conversations have no reply time, so they vanish from all three numbers. Count them separately.
- Our suggested weekly targets: median under 5 minutes in opening hours, p90 under 1 hour, zero unanswered at close.
What is the difference between mean, median and p90?
The mean (average) adds up every wait and divides by the number of conversations. The median sorts the waits and takes the middle one. The p90 sorts them and takes the value 90% of the way up the list. Mean is sensitive to extremes, median ignores them, and p90 is designed to show them.
Google's Site Reliability Engineering book, written for engineers measuring how fast websites respond, puts it neatly: the 50th percentile "emphasizes the typical case", while a high percentile "shows you a plausible worst-case value." Customer reply times behave much like web page load times. Most are quick, a few are painfully slow, and the slow ones are the ones people remember.
| Measure | What it tells you | Google Sheets formula | Blind spot |
|---|---|---|---|
| Average (mean) | Total waiting divided by conversations | =AVERAGE(B2:B21) | A few overnight waits inflate it; quick replies hide them |
| Median (p50) | What a typical customer experienced | =MEDIAN(B2:B21) | Can't see the slowest half at all |
| P90 | The wait 90% of customers beat | =PERCENTILE(B2:B21, 0.9) | Noisy with small numbers of conversations |
| Slowest reply (max) | The single worst wait | =MAX(B2:B21) | One odd case can dominate it |
| Unanswered count | Buyers who never got a reply | =COUNTBLANK(B2:B21) | Not a time, so it's left out of reply-time reports |
A 20-message example: the average says 22 minutes, but nobody waited 22 minutes
Example: a small cosmetics page in Lahore, one owner and one helper, open 11 am to 9 pm. Here are the first-reply waits, in minutes, for 20 conversations on a Tuesday, sorted from fastest to slowest. The numbers are illustrative.
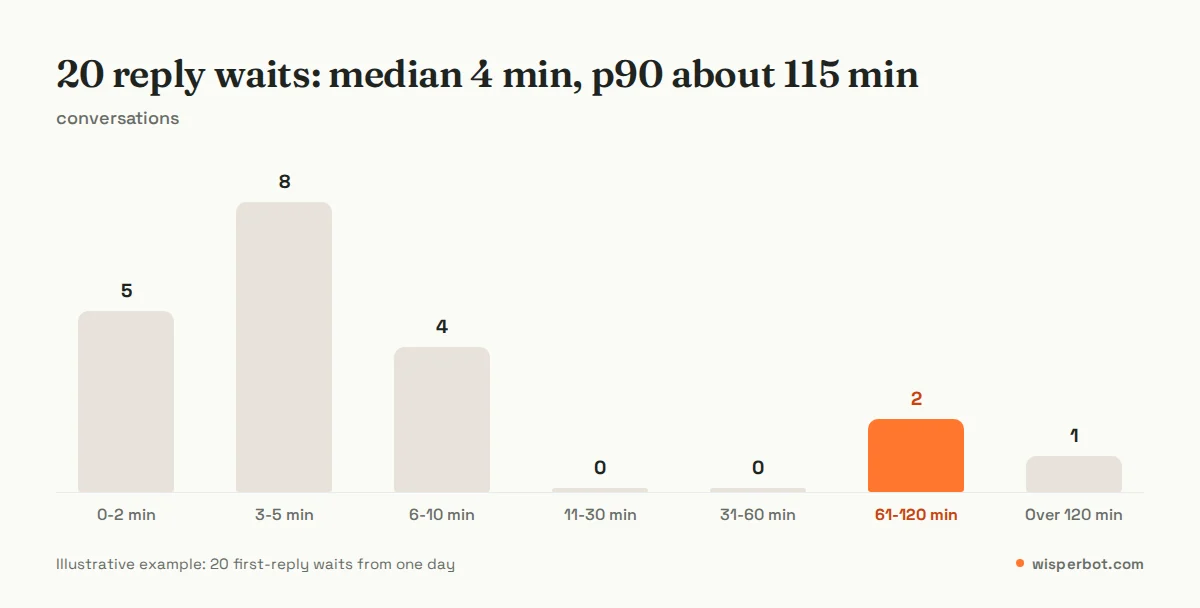
1, 1, 2, 2, 2, 3, 3, 3, 4, 4, 4, 5, 5, 6, 6, 7, 8, 115, 120, 130
Seventeen people got a reply within eight minutes. Three waited roughly two hours. Those three messaged between 2 pm and 3 pm, while the owner was at the courier office and the helper was packing orders.
Now the three summary numbers:
- Average: 431 minutes of total waiting ÷ 20 = 21.6 minutes.
- Median: the 10th and 11th values are both 4, so the median is 4 minutes.
- P90: 90% of the way up the sorted list lands between the 18th value (115) and the 19th (120). Sheets'
PERCENTILEgives 115.5 minutes.
The average of 21.6 minutes sounds acceptable. It isn't true for anyone. Seventeen customers had a much better experience, and three had a far worse one. The median of 4 minutes looks excellent and tells the owner to change nothing. Only the p90 shows that something regularly goes wrong. Here it was one hour, 2 pm to 3 pm, and in a two-person shop that kind of gap tends to repeat daily.
Two hours in a DM is long enough for a buyer to find the same lipstick shade on another page. If the owner only ever looked at the median, those losses would never show up in a report. They'd just be orders that didn't happen.
How do you calculate p90 reply time?
List each conversation's first-reply wait in minutes, then use =PERCENTILE(range, 0.9) in Google Sheets or PERCENTILE.INC in Excel. By hand, sort the waits and take the value 90% of the way up. With 20 conversations that sits between the 18th and 19th slowest. Different tools interpolate slightly differently, which matters little with enough data.
- Collect a week of conversations with the customer's first message time and your first real reply time. Leave out auto-greetings; they aren't replies.
- Work out each wait in minutes. In Sheets,
=(C2-B2)*1440converts a date-time difference into minutes. - Split the list by channel. WhatsApp and email waits shouldn't share one percentile.
- Run
=MEDIAN()and=PERCENTILE(…, 0.9)on each channel's column. - Count conversations with no reply separately (see the next section).
- Write the three numbers in the same place every week so you can see the trend.
A note on precision. The US National Institute of Standards and Technology points out that there are several accepted ways to calculate a percentile and that they "can differ noticeably for small samples". If you have 15 conversations a week, the p90 is really just "your second-slowest reply". That's still worth looking at. Just don't treat a move from 48 to 52 minutes as news.
Why does the unanswered count matter even more?
A conversation nobody replied to has no reply time, so it drops out of the average, the median and the p90. A shop that ignores its hardest messages can therefore show better reply-time numbers than one that answers everything slowly. The unanswered count is the only number that catches the customers you've lost completely.
This isn't a quirk of one spreadsheet. Intercom's help centre, for instance, says a conversation needs "a pair of customer message + teammate message" to count towards its median response time. That's a reasonable way to define a response time. It just means you need a second number for the conversations that never got one.
In our Lahore example, suppose two more buyers messaged at 2:30 pm and nobody ever replied. The median is still 4 minutes and the p90 is still about 115. Nothing in those numbers tells you two people were ignored. That's why we put "unanswered at close" at the top of the weekly check, above the median.
Which reply-time number should a small seller watch?
Watch three numbers every week, in this order: unanswered conversations at close of day, p90 first-reply time, and median first-reply time, each split by channel. The median checks that the basics work; the p90 and the unanswered count find the customers the basics missed.
Targets we suggest for WhatsApp, Instagram and Messenger (our recommendation, not an industry standard):
- Unanswered at close: zero.
- Median first reply in opening hours: under 5 minutes.
- P90 first reply in opening hours: under 1 hour.
- Night-time messages: look at these on their own, on the calendar clock. If most wait until morning, that's a coverage gap, not a speed problem.
Don't drop the median. It's still the best single description of a normal day, and it's what most reporting tools show by default. Our first response time guide covers the business-hours versus calendar-hours choice, and the full Monday checklist is in 7 numbers every DM seller should check every Monday.
What usually makes the p90 bad
When the slowest 10% are slow, the cause is usually a pattern, not bad luck. Look at the slow conversations one by one and you'll typically find one of these.
- One dead hour. Lunch, the courier run or school pickup. The same hour shows up every day.
- A forgotten channel. Everyone watches WhatsApp; Instagram DMs sit for hours because nobody opens the app.
- Stuck handovers. The bot passed the conversation to a person, and nobody was told.
- Awkward questions. Refunds, damaged items and "where is my parcel?" get put off because they're unpleasant.
- Late evenings. Messages after 9 pm wait until the next morning.
Each has a different fix: cover the dead hour, put every channel in one inbox, make handovers notify someone, write saved replies for the awkward questions, and give night messages an automatic first answer.
Where WisperBot fits
WisperBot, a reply-first inbox for WhatsApp, Instagram, Messenger and website chat, shows median first response time, median resolution time, an SLA trend and an agent leaderboard in Reports, with a performance digest email every Monday. It doesn't show p90 yet. It also doesn't export conversations or reply times (the export covers contacts), so until p90 arrives, note the first-reply times for a week's conversations from the inbox and use the spreadsheet method above. Putting every channel in one inbox helps with the "forgotten channel" problem, and a Smart Bot can answer common questions in seconds during dead hours and at night, then hand over to a person. Details are on the inbox page.
Frequently asked questions
What is p90 response time?
P90 response time is the 90th percentile of your reply waits: 90% of customers got a reply within this time and 10% waited longer. If your p90 is 45 minutes, one customer in ten waited more than 45 minutes. It's a simple way to keep an eye on your slowest replies without being thrown by one extreme case.
Is median or average better for measuring response time?
Median is better for describing a typical customer's wait, because a few overnight waits don't distort it. The average mixes very fast and very slow replies into a number that often matches nobody. Neither shows the slowest customers, so pair the median with p90 and a count of unanswered conversations.
What is a good p90 reply time for a small online shop?
For WhatsApp, Instagram and Messenger during opening hours, we suggest keeping p90 under one hour, with a median under five minutes. Measure night-time messages separately on the calendar clock. If your p90 is several hours, look for a pattern such as a dead hour or a channel nobody checks.
How many conversations do I need for p90 to mean anything?
Below about 20 conversations a week, p90 is little more than your second or third slowest reply, so it jumps around. That's still useful as a list of cases to look at. With 100 or more conversations it becomes a steady number you can set a target against and track week to week.
Why is my average response time so high when replies feel fast?
Usually because a handful of conversations waited many hours, often overnight or during one busy hour, and they pull the average up. Sort your waits from slowest to fastest and look at the top five. You'll normally find a pattern you can fix, and your median will confirm most replies are quick.
Sources
- Google: Site Reliability Engineering, chapter 4, Service Level Objectives
- NIST/SEMATECH e-Handbook of Statistical Methods: Percentiles
- Google Docs Editors Help: PERCENTILE function
- Google Docs Editors Help: MEDIAN function
- Intercom Help: See how quickly your team respond to and close conversations
Last checked: 8 October 2026.